In previous article I wrote how to subscribe to MQTT topics and display also timestamp with color. There was one MQTT topic which represented server load and it demonstrates that MQTT could be used for server monitoring.
Here is an example how to measure server load and publish it as MQTT topic. Open crontab:
crontab -e
Add following line:
* * * * * /usr/bin/mosquitto_pub -t /server/reactor/load -m `cat /proc/loadavg | sed -e 's/ .*//g'`
Cron will invoke the command every minute. Command will publish data to MQTT topic /server/reactor/load (note: reactor is the name of my server).
We can subscribe at a workstation to the topic and execute some commands. mosquitto_sub will keep running in the background and we can use xargs to invoke a new command once the new message arrives.
Following example shows how to display notification on Linux Mint – Cinnamon using
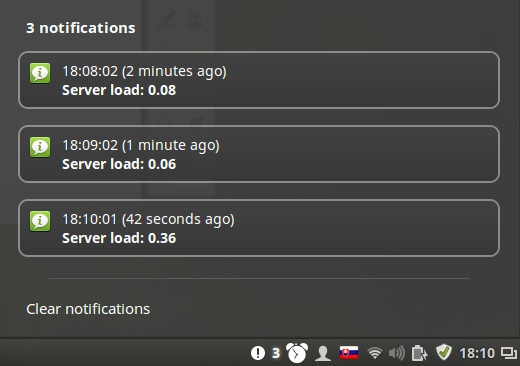
mosquitto_sub -t '/server/reactor/load' -h iot.sinusgear.com | xargs -d$'\n' -L1 sh -c 'notify-send "Server load: $0"'
The result at workstation:
![]()

The only downside is that notifications are spamming desktop every minute. It does not make sense to notify admin when server load is too low. We can add a little bit of logic and display notifications about load which exceeded a certain threshold.
mosquitto_sub -t '/server/reactor/load' -h iot.sinusgear.com | xargs -d$'\n' -L1 /bin/zsh -c 'if (( $(echo "$0 > 1.2" | bc -l ) )); then notify-send "Server load: $0"; fi'
Note: just be aware that message from MQTT is not sanitized. Run such command only in trusted environment or add type check of value received from MQTT.
Enjoy :-)