Google Chrome developer tool is simply one of the best tools available for debugging of HTML5 applications.
It has one neat feature: possibility to inspect CSS of element and editing it on the fly.
That works fine for normal styles, but what about :hover state?
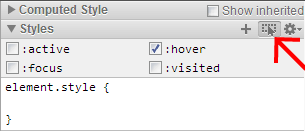
There is one “hidden” option which allows to switch element to :hover state.
Inspect element of HTML. You should see Styles on the right hand side. There are 3 icons. Click the middle one with arrow sign. It will pop up menu with checkboxes. You can select here CSS pseudo classes like :active, :focus, :hover or :visited.

To learn more about capabilities of Google Chrome developer tools I recommend to go through free course Discover Dev Tools from Codeschool.com.