First of all: do not use daemon mode for debugging.
IntelliJ Idea is automatically spawning daemon when you start any Gradle task. You have to attach to remote process.
I wrote small “How to debug” based on info from forums.gradle.org.
You’ll need to set GRADLE_OPTS environment variable to:
-Xdebug -Xrunjdwp:transport=dt_socket,server=y,suspend=y,address=5005
Here is example in PowerShell:
![]()
$env:GRADLE_OPTS="-Xdebug -Xrunjdwp:transport=dt_socket,server=y,suspend=y,address=5005"
Configure Remote debugging in Idea:
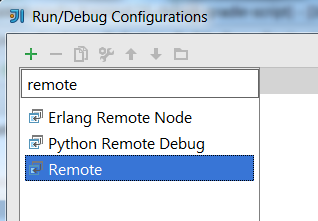
You do not need to change anything in default configuration.
Now return to command line with your project and invoke task. Gradle will automatically stop and it waits for debugger.

Attach debugger
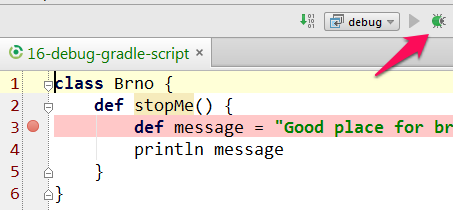
Here we go :-)
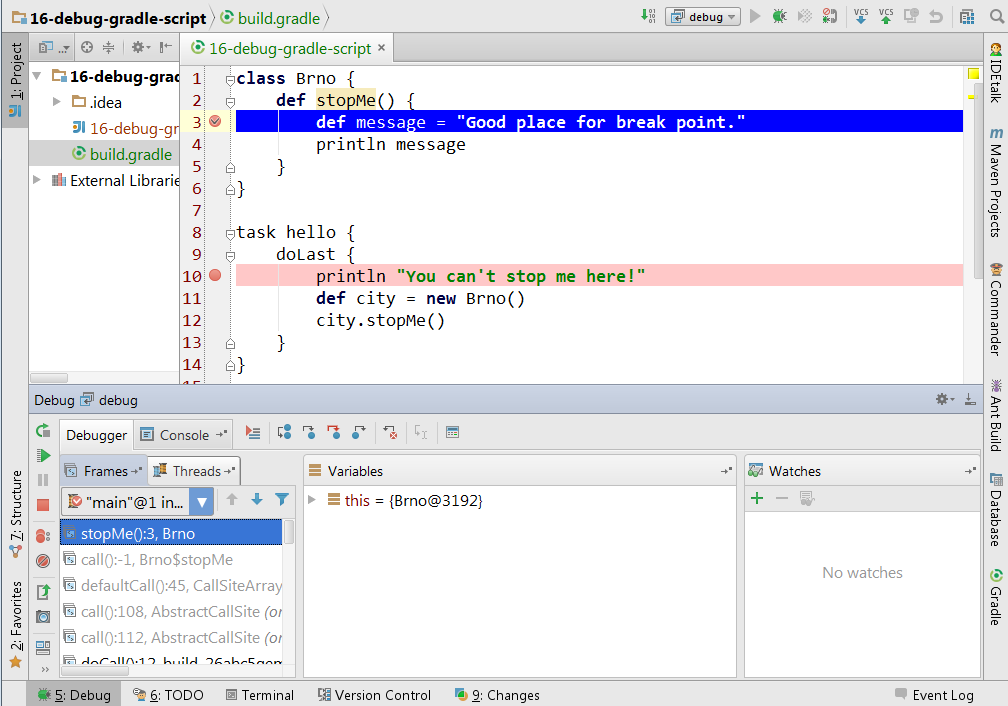
There is small limitation. You can stop code execution outside DSL e.g. in class method (line 3). You won’t be able to stop execution in Gradle DSL line 10.
You can download sample build script from Github.
Why does the limitation exist? Ideally any line in the gradle script should just be debuggable by default in IntelliJ… pity.